HEVD Driver Exploitation - Part 1: Setting Up the Environment
Overview
In this blog series, I’m going to provide an introduction to analyzing and exploiting a vulnerable driver on Windows. While there are many blogs already available on the topics I’m about to cover, this is an opportunity for me to reinforce my understanding of driver exploitation.
Additionally, since I’m on my journey of learning C, I will not only be writing/describing my exploit code for these tutorials in Python, but also in C!
In this part, I’m going to cover the setting up of the test environment. While this may not be the most fun, it’s a crucial part. If this your first time performing this process, this should help you out. I remember my first time going through the process of setting up the test environment and had to refer to a few online articles. So, hopefully this will be your one-stop shop!
Setting Up the Environment - Tools
First things first, we’ll have to setup the test environment for kernel debugging.
Here’s what you’ll need, to follow along with the setup process:
- Windows 7 32-bit virtual machine (VM)
- HackSysExtremeVulnerableDriver v3.0 (HEVD)
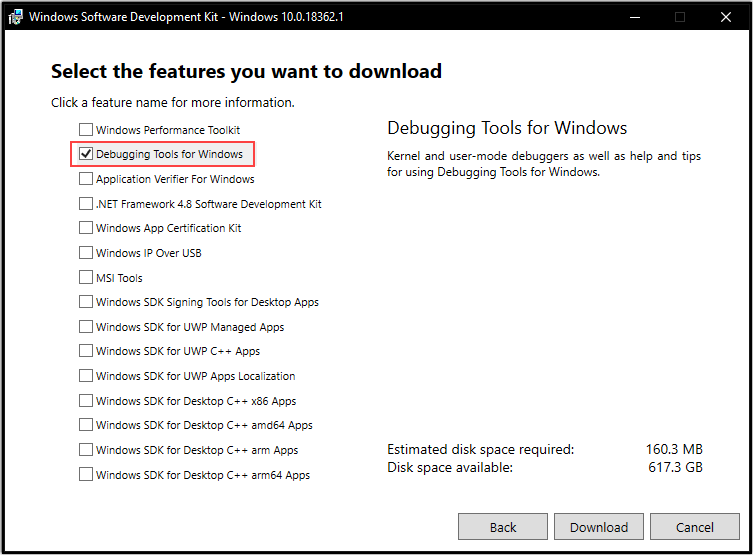
- WinDBG (You’ll only need to install ‘Debugging Tools’)
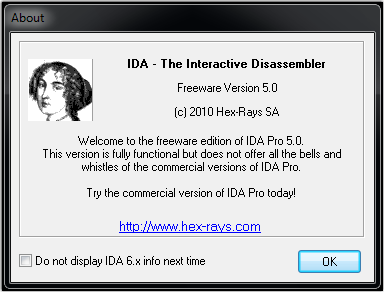
- IDA Freeware
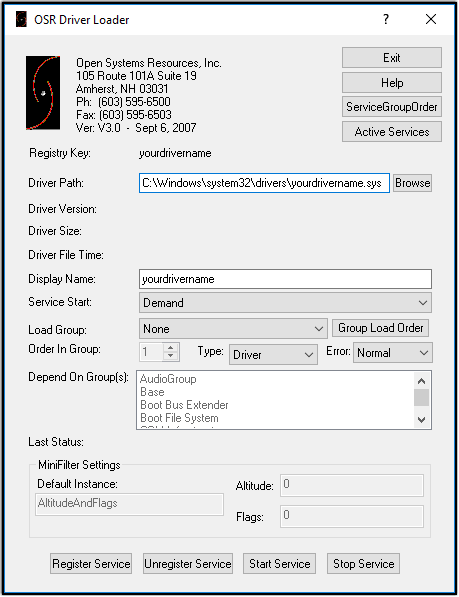
- OSRLOADER (Registering the vulnerable driver)
- Text-Editor (I recommend Sublime Text)
- Python or C (or both!)
Setting Up the Environment - Debugger
Now that you’ve retrieved all the necessary tools listed above, let me provide some detail on how I go about setting up the environment. (I’m going to take on the assumption that you’ve already installed a fresh instance of Windows 7 x86 (whether it’d be on VMware Fusion, VMware Workstation, etc.).
Let’s called the installed Windows 7 x86 instance ‘Windows 7 (x86) - Debugger’.
Below are the list of steps I take in setting up the ‘Windows 7 (x86) - Debugger’ machine:
- First, let’s install ‘WinDBG - Debugging Tools’
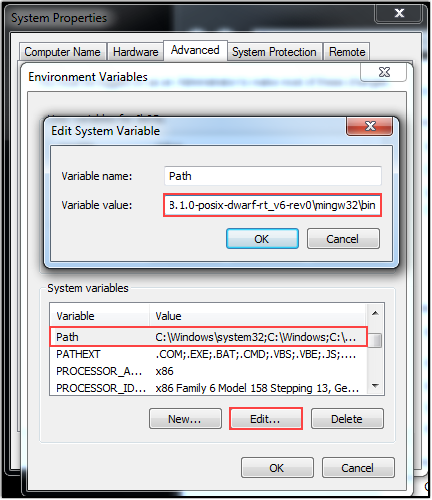
- To save time later, we’ll setup the Debugging Symbols now by creating a System Variable
- Go to Computer -> Properties -> Advanced System Settings -> Environment Variables
- Create a System Variable with the following:
- Variable Name: _NT_SYMBOL_PATH
- Variable Value: SRV*C:\Symbols*https://msdl.microsoft.com/download/symbols
- Next, we’ll install OSRLOADER (We’ll complete the driver registration process a bit later on)
- After installing OSRLOADER, we’ll proceed by installing IDA Freeware
- Following IDA Freeware, let’s install Python and/or Mingw-w64 for GCC (and add them to our Environment Variables - ‘Path’ for ease)
- C:\Program Files\mingw-w64\i686-8.1.0-posix-dwarf-rt_v6-rev0\mingw32\bin
- C:\Python27
- Next, let’s extract the HackSysExtremeVulnerableDriver contents to the Desktop
- Additionally, since this is the Debugger machine, let’s save some time and headache by placing the ‘HEVD.pdb’ file in the following directory (So WinDGB can resolve the driver symbols)
- For HEVD-v3.0 - C:\projects\hevd\build\driver\vulnerable\x86\HEVD\HEVD.pdb
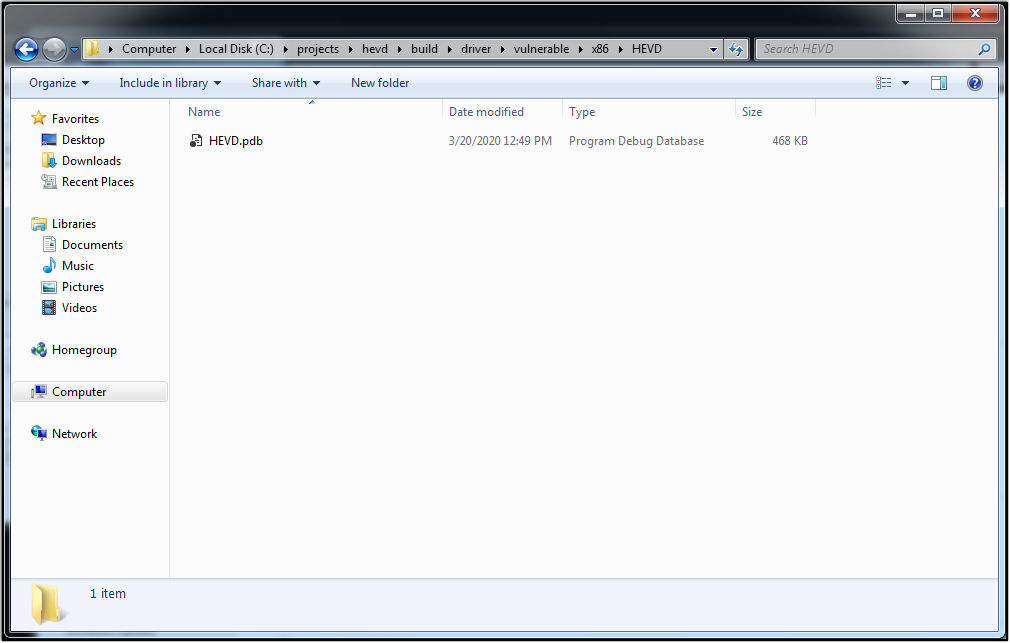
- For HEVD-v3.0 - C:\projects\hevd\build\driver\vulnerable\x86\HEVD\HEVD.pdb
- Additionally, since this is the Debugger machine, let’s save some time and headache by placing the ‘HEVD.pdb’ file in the following directory (So WinDGB can resolve the driver symbols)
- Lastly, for the Windows 7 (x86) - Debugger machine, install your favorite text editor.
Setting Up the Environment - Debuggee
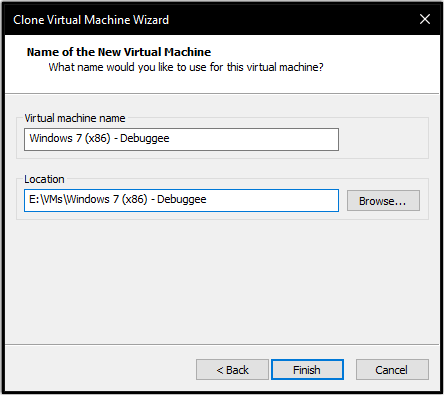
Now with the Windows 7 (x86) - Debugger machine setup up, let’s shutdown the virtual machine and create a Linked Clone of the machine. Let’s call this cloned VM Windows 7 (x86) - Debuggee
This can be done by right-clicking on the Windows 7 (x86) - Debugger machine under your ‘VMware - Library’ -> Manage -> Clone -> Create a linked clone
Now that we’ve successfully cloned Windows 7 (x86) - Debugger as Windows 7 (x86) - Debuggee, there’s very little we’ll have to do in terms of setup.
Below is a list of steps we’ll have to do on the Windows 7 (x86) - Debuggee machine:
- Using BCD, we’ll enable debugging
- Run CMD as Administrator, and execute the following commands:
- bcdedit /copy {current} /d “Debug”
- bcdedit /debug {
} on - bcdedit /dbgsettings
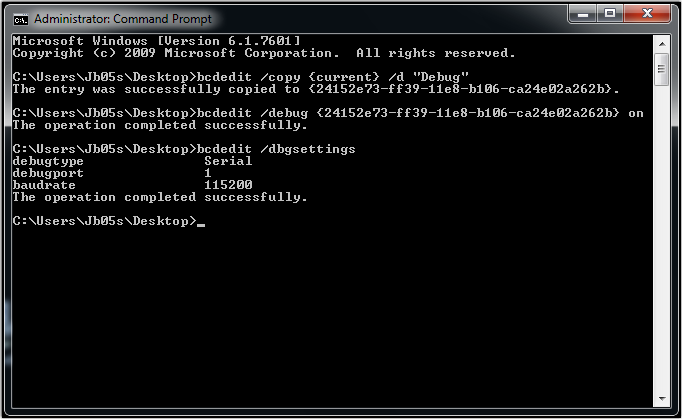
- Run CMD as Administrator, and execute the following commands:
- Lastly, we’ll need to register and start the HEVD driver using OSRLOADER
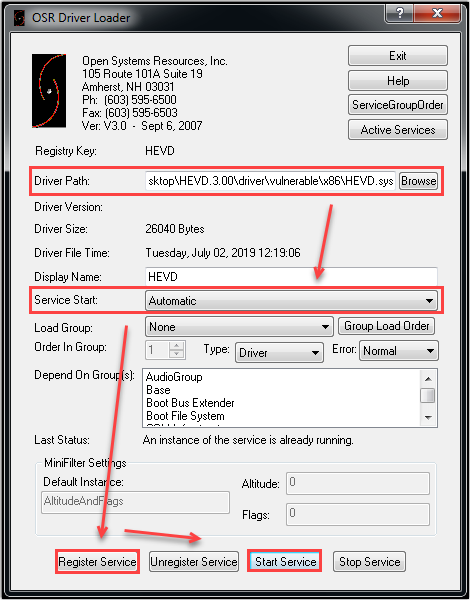
We’ve now successfully completed the setup of the Windows 7 (x86) - Debuggee machine!
Setting Up the Environment - Communication Between Debugger and Debuggee
With everything we need installed/configured on the two machines, we now have to add/modify some settings in both of the VMware Virtual Machine Configuration (.VMX) files. Since our environment is on Windows 7, and communication over a Network connection isn’t supported, we’ll need to add a Serial Port to each of the machines, in order for them to interact with one another.
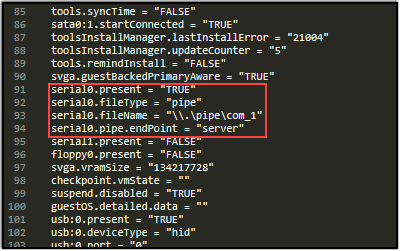
For the Debugger machine, add the following to the .VMX file:
- serial0.present = “TRUE”
- serial0.fileType = “pipe”
- serial0.fileName = “\.\pipe\com_1”
- serial0.pipe.endPoint = “server”
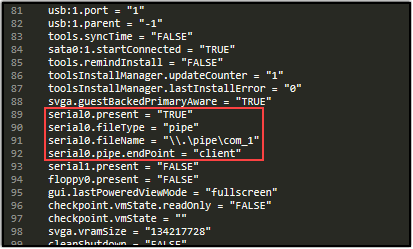
For the Debuggee machine, add the following to the .VMX file:
- serial0.present = “TRUE”
- serial0.fileType = “pipe”
- serial0.fileName = “\.\pipe\com_1”
- serial0.pipe.endPoint = “client”
After saving the changes made to the .VMX files, let’s test to make sure our connection between the Debugger and Debuggee machines are good.
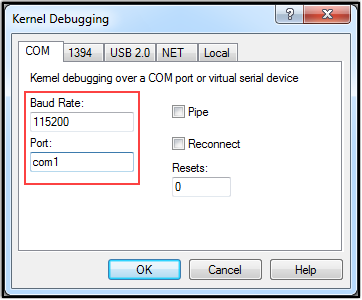
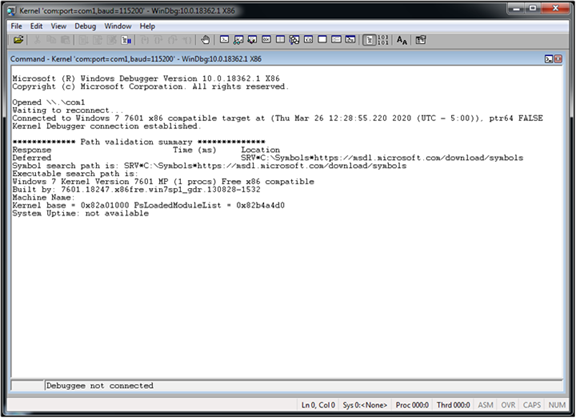
To do this, we first have to boot up the Windows 7 (x86) - Debugger machine, and open WinDBG. From within WinDBG, we need to go to File -> Kernel Debug.. -> COM and verify that the Baud Rate value matches what’s disclosed in the bcdedit /dbgsettings command we ran in the previous section, and that the Port value is set to com1. Click OK once you’ve verified the settings.
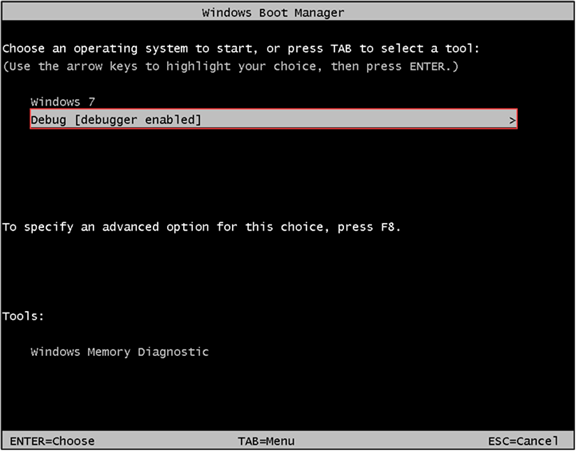
Now, with Windows 7 (x86) - Debugger machine waiting for Windows 7 (x86) - Debuggee to connect, let’s boot it up and select “Debug” from the Windows Boot Manager screen.
If you’ve managed to follow all the steps above correctly, when you switch back over to your Windows 7 (x86) - Debugger machine running WinDBG, you should see that you’ve successfully made a connection to the Windows 7 (x86) - Debuggee machine!
Setting Up the Environment - Verifying Driver
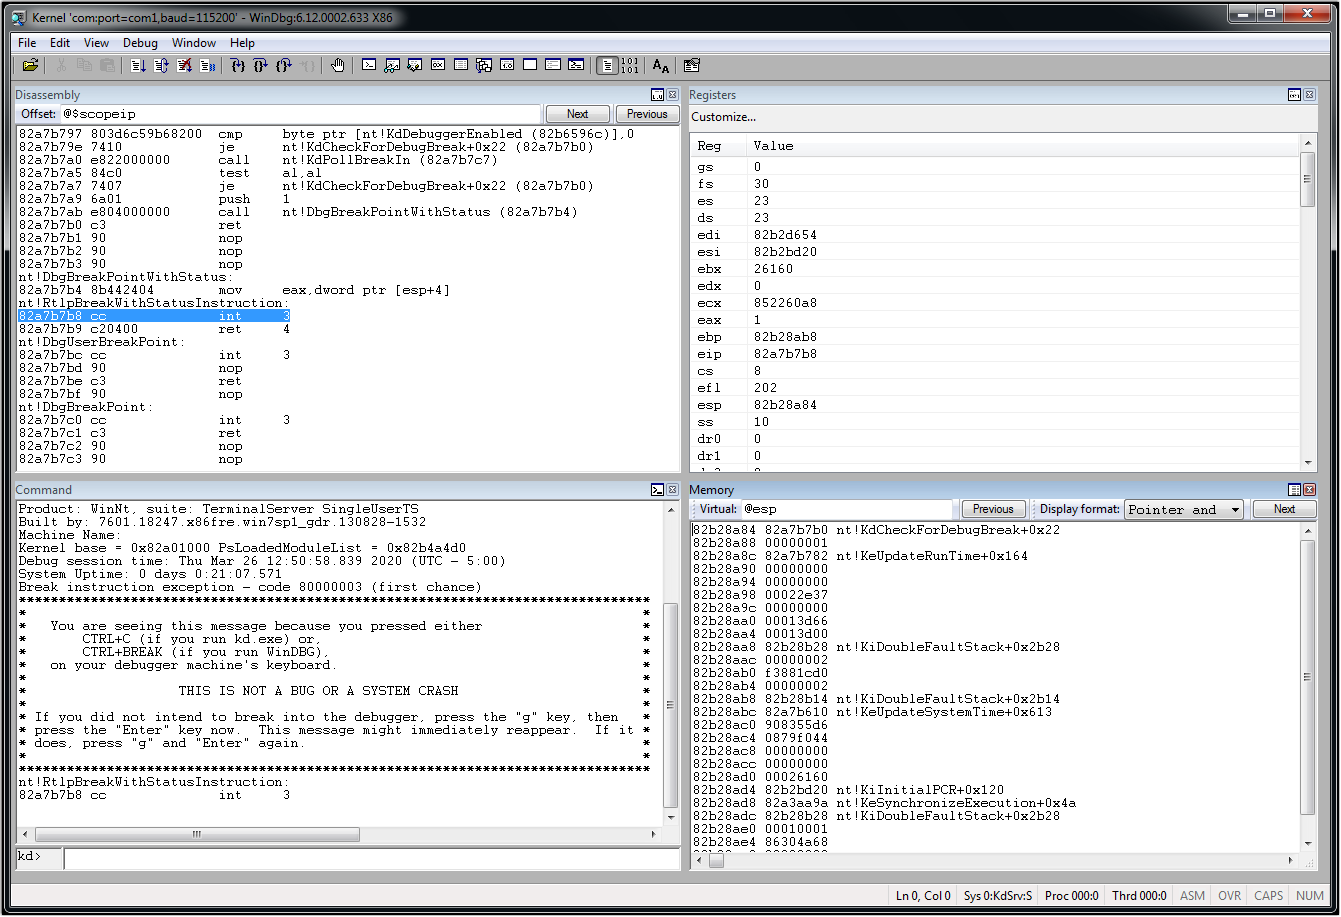
With a successfully connection made between the debugger and debuggee, we’ll do one last check to make sure that everything is configured properly, before moving forward.
Let’s break into the debuggee from WinDBG (CTRL + Break) on Windows 7 (x86) - Debugger, and verify that we see that the HEVD module has been loaded, and that its symbols have been successfully mapped.
This can be done by running the following commands within WinDBG:
- lm m H* (Query the loaded modules that begin with the letter ‘H’)
- x /D HEVD!a* (Query the list of functions within the ‘HEVD’ module that begin with the letter ‘A’)

If you were not successful in enumerating HEVD , check to see if you successfully registered and started the HEVD service via OSRLOADER on Windows 7 (x86) - Debuggee.
If you cannot enumerate the HEVD functions, check to make sure that the HEVD.pdb file is in the correct directory on Windows 7 (x86) - Debugger
Tips and Tricks
In my short time of kernel exploitation, and the use of WinDBG, I’ve come across a few tidbits that I’ve found helpful (and saved me a bunch of time).
Below are a few things I do on my Debugger machine to save some time and relieve myself from having to perform the same processes over and over again.
- Pin ‘cmd.exe’ and ‘WinDbg (x86)’ to my taskbar
- In the ‘cmd.exe’ properties, I set the Start in: variable to - %HOMEDRIVE%%HOMEPATH%\Desktop
- In the ‘WinDbg (x86’) properties, I set the Start in: variable to - %HOMEDRIVE%%HOMEPATH%\Desktop
- I change this variable to start in the directory where I have my Workspace file (.WEW) saved
- In the ‘WinDbg (x86)’ properties, I set the Target: variable to - “C:\Program Files\Windows Kits\10\Debuggers\x86\windbg.exe” -k com:port=COM1,baud=115200
- This will have WinDbg automatically setup the communication between the debugger and debuggee upon opening WinDbg
- Create a workspace file for WinDbg
- If you like the windows setup from Immunity Debugger (assuming you’ve used Immunity Debugger before), a workspace file will save you some time.
- Here’s what mine looks like
Wrapping Up
If you’ve made it this far, and have successfully confirmed everything’s working up to this point, AWESOME!!
We can now move onto the fun stuff!
In the next part of this tutorial series, we’ll begin analyzing the HEVD driver in IDA Freeware. After analyzing the HEVD driver, we’ll use the information gathered during the analysis to start building our exploit for HEVD’s - Stack Overflow vulnerability.

If you had any issues following along, or noticed a lack in detail, please don’t hesitate to reach out. Thanks!